This is a really great diagram that I first saw at the vvvv node10 event in Frankfurt. It was made to represent the hype around new technologies, but I think it might be applicable more broadly. In any case it's a useful reference point:
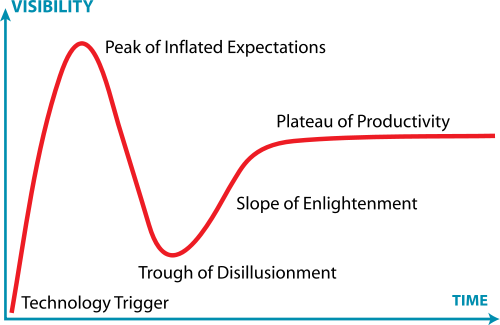
It was developed by Gartner, but a good place to read about it is the Wikipedia page.